5.4. Handling KML/glTF models with online spreadsheet
As mentioned before, the 3D web client extends the Cesium Virtual Globe to support efficient displaying, caching, dynamic loading and unloading of large pre-styled 3D visualization models in the form of tiled KML/glTF datasets exported the 3DCityDB using the KML/COLLADA/glTF Exporter. However, there is a major problem regarding the graphical visualization of semantic 3D city models as their attribute information is completely or partly lost in the 3D graphics formats. This issue has been considered and solved within the 3D web client by supporting the explicit linking of the 3D visualization models with thematic data which can be exported using the Spreadsheet Generator Plugin (SPSHG) and uploaded to an online spreadsheet (Google Fusion Table) stored and published via the Google Cloud. This strategy can therefore offer the possibilities for collaborative and interactive data exploration of semantic 3D city models by means of querying the thematic data of the selected city object. The corresponding system architecture is illustrated in the following figure.
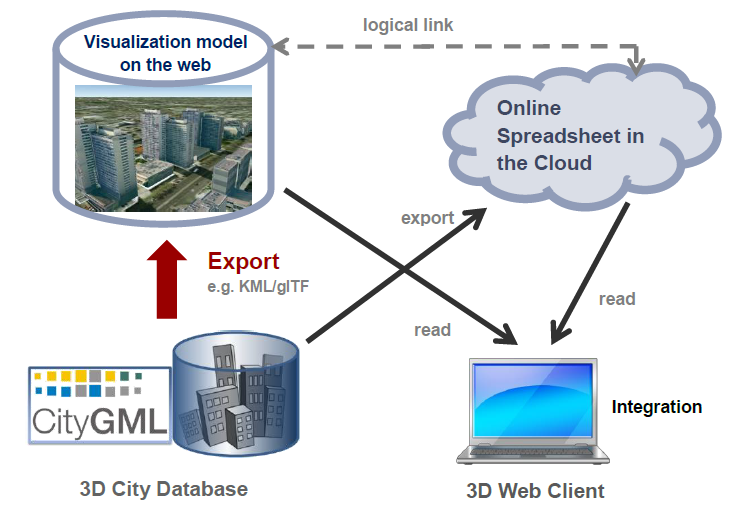
Fig. 5.8 Coupling an online spreadsheet with a 3D visualization model (i.e. a KML/glTF visualization model) in the cloud [HeNK2012]
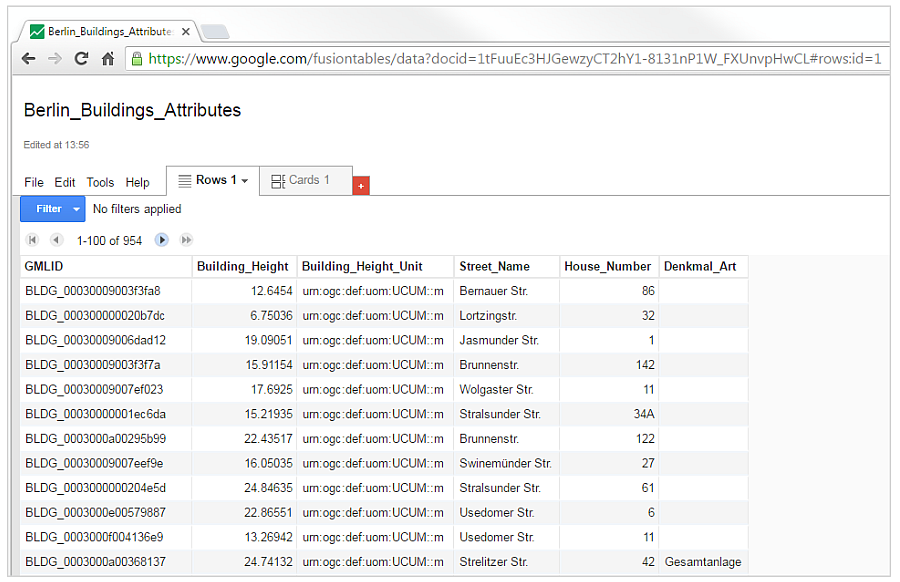
Fig. 5.9 Example of an online spreadsheet (Google Fusion Table)
Similar to the structure of a database table, the first row of the
online spreadsheet defines the attribute names, and the further rows
store the respective attribute values for each 3D object. The logical
links between the 3D models and the respective rows are established via
a specific column within the spreadsheet, namely the GMLID column, which
contains the unique identifiers of the 3D objects. Each further column
is used to represent one attribute of the 3D object. By using the freely
available Google Drive application, all users having access to the
online spreadsheet are able to edit it, for example to modify attribute
values or insert new attribute fields, in order to keep the contents
up-to-date without affecting the original (possibly official) 3D city
model. Besides, such a detachment of the thematic data from the 3D
visualization models also has the advantage that any update of thematic
contents can exclusively take place within the online spreadsheet and
therefore does not require exporting and deploying the 3D visualization
models again.
In order to add a KML/glTF data layer along with its linked online spreadsheet to the 3D web client, the parameters must be properly specified (some of which are optional) on the corresponding input panel [1] (cf. Fig. 5.10) which can be expanded and collapsed by clicking on the Add / Configure Layer button.
Note
All default parameter values used in the 3D web client were chosen accordingly to the standard settings (e.g., the standard predefined tile size is 125m x 125m) specified in the preference settings of the KML/COLLADA/glTF Exporter (cf. Section 3.6.3.1). The parameter name with the suffix “(*)” denotes that this parameter is mandatory; otherwise it is optional.
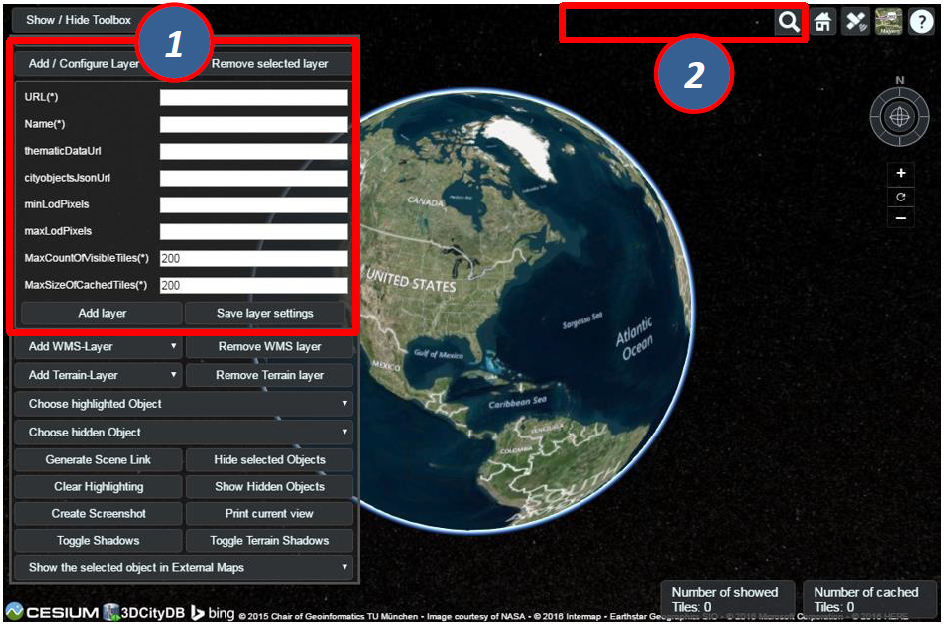
Fig. 5.10 The input panel [1] for adding a new KML/glTF data layer and
the extended Geocoder widget [2] allowing to search a 3D object also by
its gmlId
First of all, the web link of the master JSON file (cf. Section 3.5) holding the relevant meta-information of this data layer has to be entered into the input field URL()*. In the input field Name()*, a proper layer name must be specified which will be listed at the top of the input panel [1] once the KML/glTF data layer has been successfully loaded into the 3D web client. The parameter thematicDataUrl denotes the URL of an online spreadsheet (Google Fusion Table) which stores the attribute data. This parameter is optional and is only required if the user wants to attach thematic data to the KML/glTF visualization model.
The next optional parameter cityobjectsJsonUrl holds the URL of the JSON file which can be generated automatically by using the KML/COLLADA/glTF Exporter (cf. Section 3.6.3.1). This JSON file contains a list of GMLIDs of all 3D objects which were exported and might be distributed over different tiles. For every 3D object, it is also stored in which tile it is contained together with its envelope represented using a bounding box in WGS84 lat/lon. These location information can be used to search for a certain 3D object with the help of the Geocoder widget [2], which has been extended to support a specific geocoding process performed in the following manner: In the input field, either a GMLID of a 3D object or an address can be entered. If an object with the given GMLID is found in the JSON file, the camera perspective will be adjusted to look at the center point of the 3D object with a proper oblique view. If not, the Bing Maps Locations API will be automatically called and the map view will be adjusted to the returned location and bounding box.
The combination of the parameters minLodPixels and maxLodPixels defines the minimum and maximum limit of the visibility range for each data layer to control the dynamic loading and unloading of the data tiles. The maximum visibility range can start at 0 and end at an infinite value expressed as -1. Optionally, the user can directly specify the two parameter values within the 3D web client. Otherwise, the parameter values will be achieved from the master JSON file, which also contains the parameters minLodPixels and maxLodPixels and their values which have been specified using the KML/COLLADA/glTF Exporter before performing the export process.
With these two parameters, the 3D web client implements the so-called Level of Details (LoD) concept which is a common solution being used in 3D computer graphics and GIS (e.g. KML NetworkLinks) for efficient streaming and rendering of tiled datasets. According to the LoD concept, the data tiles with higher resolution should be loaded and visualized when the observer is viewing them from a short distance. When data tiles are far away from the observer, the data tiles with higher resolution should be substituted by the data tiles with lower resolution. In order to realize this LoD concept in the 3D web client, each data tile which is being intersected with the current view frustum will be projected onto the screen while navigating the Earth map. Subsequently, the diagonal length of the projected area on the screen will be calculated by the 3D web client to determine whether the respective data tile should be loaded or unloaded. If the diagonal length is greater than minLodPixels and less than maxLodPixels, the respective data tile will be loaded and displayed; otherwise it will be hidden from display and unloaded. Of course, all data tiles lying outside of the view frustum are unloaded and invisible anyway.
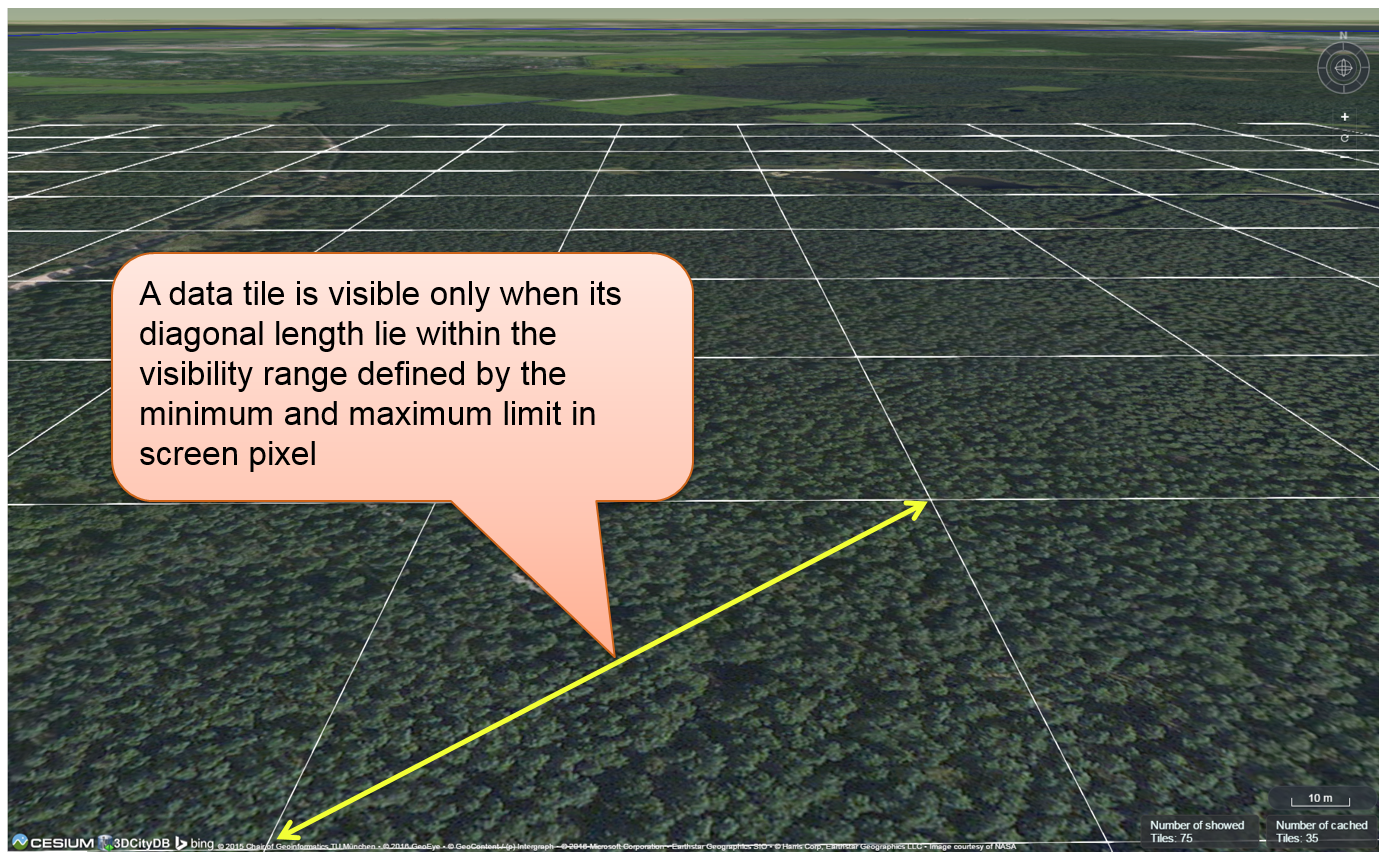
Fig. 5.11 Efficient determination of which data tiles should be loaded according to the user-defined visibility range in screen pixel
Loading massive amounts of data tiles often result in poor performance of the 3D web client or even memory overload of the web browser. This could happen when, for example, the visibility range (determined by the parameters minLodPixels and maxLodPixels) starts at a very small value and ends at an infinite size. In this case, each data tile will always be visualized even though it only takes up a very small screen space. This issue can be avoided by a proper setting of the parameter maxCountOfVisibleTiles which specifies the maximum number of allowed visible data tiles. When this limit is reached, any additional data tiles that are farthest away from the camera will not be shown, regardless the size of screen space they occupy. Per default, this parameter receives a value of 200, which is appropriate in most use cases. However, depending on data volume of each tile and the hardware you use, this parameter value has to be adjusted by means of practical tests.
As mentioned before, the 3D web client implements a caching mechanism allowing for high-speed reloading of those data tiles that have been loaded before and which are stored in the memory of the web browser. In order to prevent memory overload, the parameter maxSizeOfCachedTiles can be applied for specifying the maximum allowable cache size expressed as a number of data tiles. With this parameter, the 3D web client implements the so-called Least Recently Used (LRU) algorithm which is a caching strategy being widely used in many computer systems. According to this caching algorithm, newly loaded data tiles will be successively put into the cache. When the cache size limit is reached, the 3D web client will remove the least recently visualized data tiles from the cache. By default, the value of this parameter is set to 200 and can of course be increased to achieve a better viewing experience depending on the hardware you use.
Usage example
In this example, a tiled KML dataset containing around 8000 LoD1 buildings in the Manhattan district of New York City (NYC) will be visualized on the 3D web client. This KML dataset is derived from the semantic 3D city model of New York City (NYC) which has been created by the Chair of Geoinformatics at Technical University of Munich on the basis of datasets provided by the NYC Open Data Portal. The following parameter values should be entered into the corresponding input fields:
- url: https://www.3dcitydb.org/3dcitydb/fileadmin/public/3dwebclientprojects/NYC-Model-20170501/Building_gltf/Building_gltf_collada_MasterJSON.json
- name: NYC_Manhattan_Buildings
- thematicDataUrl: https://www.google.com/fusiontables/DataSource?docid=1iG6_vYe7JGTNAUwFw7TpD8EMO-iQe6gSpa6MJlCF
- cityobjectsJsonUrl: https://www.3dcitydb.org/3dcitydb/fileadmin/public/3dwebclientprojects/NYC-Model-20170501/Building_gltf/Building_gltf.json
- minLodPixels: 100
- maxLodPixels: -1
- maxSizeOfCachedTiles: 200
- maxCountOfVisibleTiles: 200
After clicking on Add layer, a data layer will be loaded into the 3D web client and the corresponding layer name NYC_Manhattan_Buildings will be listed above the input panel. The Earth map can be zoomed to the extent of the loaded data layer by double-clicking on the layer name. The parameter values of the data layer (its radio button must be activated) can be changed and applied at any time by clicking on the Save layer settings button.
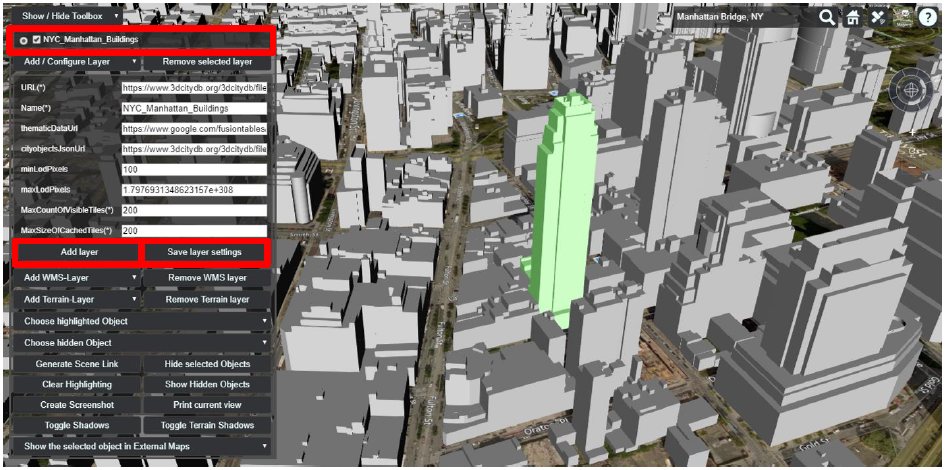
Fig. 5.12 Screenshot showing how to add a new KML/glTF data layer into the 3D web client
Users are also able to control the visibility of the selected data layers by deactivating its checkbox or clicking on the Remove selected layer button to completely remove it from the 3D web client (cf. the following two screenshots)
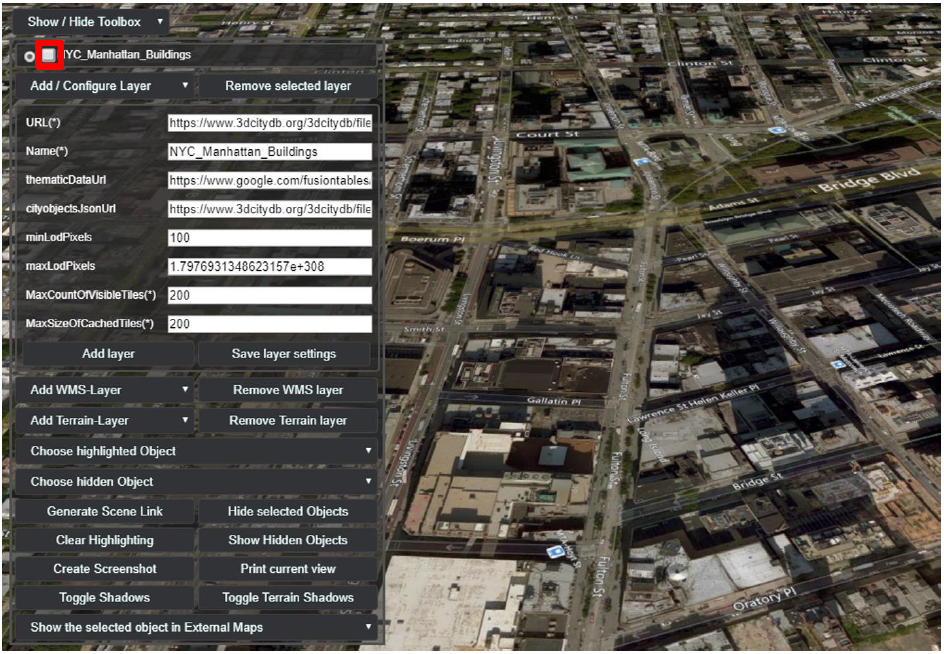
Fig. 5.13 Screenshot showing how to hide a KML/glTF data layer
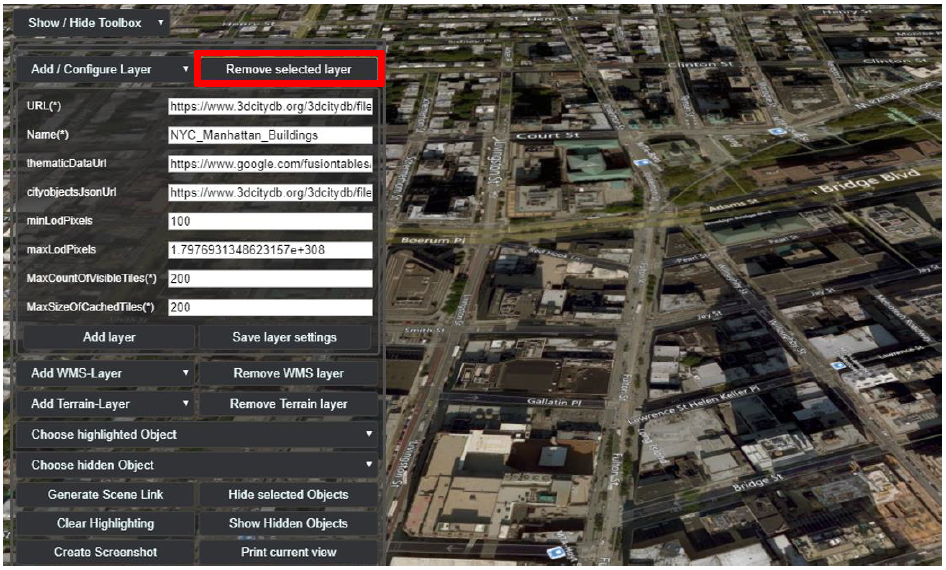
Fig. 5.14 Screenshot showing how to remove a KML/glTF data layer from the 3D web client