6.4. Enriching KML/glTF models with thematic data
As mentioned before, the 3D web client extends the Cesium Virtual Globe to support efficient displaying, caching, dynamic loading and unloading of large pre-styled 3D visualization models in the form of tiled KML/glTF datasets exported the 3DCityDB using the KML/COLLADA/glTF Exporter. However, there is a major problem regarding the graphical visualization of semantic 3D city models as their attribute information is completely or partly lost in the 3D graphics formats. This issue has been considered and solved within the 3D web client by supporting the explicit linking of the 3D visualization models with their thematic data, which can be achieved using (1) a Google Spreadsheet stored in the cloud, or (2) PostgREST, a RESTful API for PostgreSQL.
6.4.1. Storing thematic data in Google Spreadsheets
The thematic data stored in the 3DCityDB can be exported to a single
table (as a CSV .csv or an MS Excel .xlsx file) using the
Spreadsheet Generator Plugin (SPSHG)
explained in Section 5.2.
This can then be uploaded in Google Drive as
Google Spreadsheets.
This strategy can therefore offer the possibilities for collaborative and interactive data exploration of semantic 3D city models by means of querying the thematic data of the selected city object. The corresponding system architecture is illustrated in the following figure.
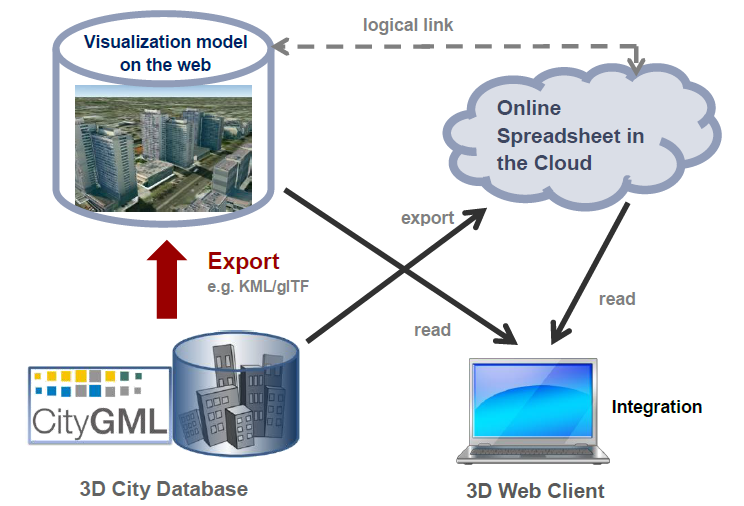
Fig. 6.8 Coupling an online spreadsheet with a 3D visualization model (i.e. a KML/glTF visualization model) in the cloud [HeNK2012]
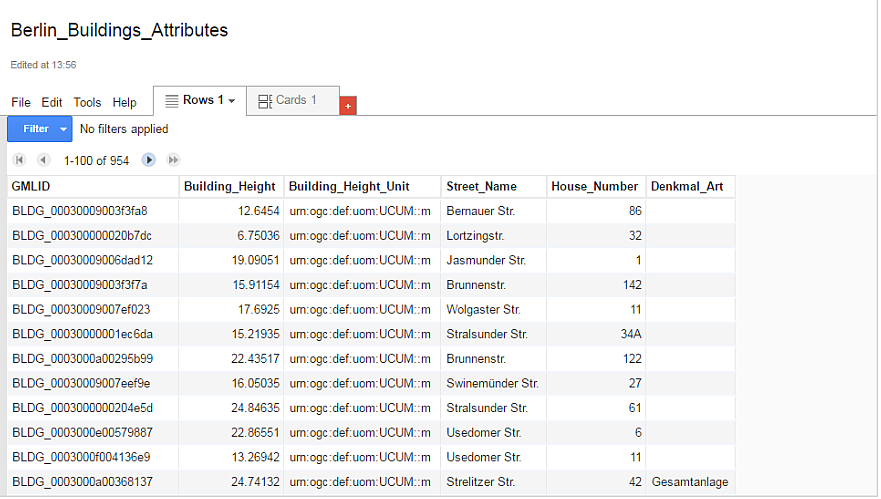
Fig. 6.9 Example of an online spreadsheet
6.4.2. Publishing thematic data using RESTful API
Alternatively, the thematic data can be published directly from the 3DCityDB using a RESTful API that is supported by the employed database (such as PostgREST for PostgreSQL).
The RESTful API allows publishing database tables or SQL views on the internet. This approach therefore provides developers full control over: (1) where the resources are being hosted (i.e. independent from third-party cloud service providers), (2) which resources should be published, and (3) who can have access to which resources.
This approach requires however a good understanding of the 3DCityDB schemata (see Section 3.2) as well as familiarity with SQL in general (in order to define custom SQL views to publish directly from the database). For PostgREST, a very good tutorial is available.
Collaborative editing of the published thematic data is theoretically possible, it depends however greatly on the implementation of the employed RESTful services on the database side.
6.4.3. Structure of the tables containing thematic data
Since Google Fusion Tables
was shut down
on Dec 3, 2019, starting from version 1.9.0,
the 3DCityDB Web Map Client is capable of fetching data published from
Google Sheets API v4
and a PostgreSQL database with a RESTful API enabled (PostgREST).
Data fetched from Google Sheets API and PostgREST can be displayed on the infobox
as thematic data when a city object is clicked.
Please refer to Section 6.4.4 for a brief tutorial
as how to import KML/glTF models with thematic data in the 3D web client.
In addition to the two new supported data sources,
it is now also possible to choose their tableType
between All object attributes in one row (horizontal)
and One row per object attribute (vertical), where:
Horizontal: all object attributes are stored in columns of one single row, which means each ID occurs only once in the table. This is applicable if all objects have the same or similar attributes.
Note
The thematic data must be stored in the first sheet of the spreadsheet. The first column of this sheet must be called
gmlidorGMLID.Example:
gmlid attribute1 attribute2 attribute3 attribute4 gmlid1 value1 value2 value3 value4 gmlid2 value1 value2 value3 value4 Vertical: each object attribute is stored in one row consisting of three columns
ID,AttributeandValue, which means an ID may occur in multiple rows in the table. This is used when the numbers of attributes or attribute names vary greatly between objects.Note
A vertical table must contain exactly three columns in this exact order:
gmlid,attributeandvalue.Example:
gmlid attribute value gmlid1 attribute1 value1 gmlid1 attribute2 value2 gmlid1 attribute3 value3 gmlid2 attribute1 value1 gmlid2 attribute2 value2 gmlid2 attribute3 value3 gmlid2 attribute4 value4
For an overview of the responses from the Google Sheets API, please refer to the official documentation.
The response from PostgREST service is encoded in JSON with the following structure:
Both the horizontal and vertical mode consist of an array of records marked by the
[ ... ].Each record represents a line in the table, where:
Each record in vertical mode only has exactly 3 elements:
gmlid, attribute name and attribute value. Thegmlidshere can be duplicated in other records, but the combination of the first two columns must be unique.[ { gmlid : "id1", value_name : "value_name", value : "value" }, { gmlid : "id2", value_name : "value_name", value : "value" }, ... ]
On the other hand, each record in the horizontal mode can have more than 2 elements, but the first one must always be
gmlidand this must be unique for each record.
6.4.4. Importing KML/glTF models with thematic data
In order to add a KML/glTF data layer along with its linked thematic data
to the 3D web client, the parameters must be properly
specified (some of which are optional) on the corresponding input panel
(cf. Fig. 6.10) which can be expanded and collapsed by clicking on
the Add / Configure Layer button in the top left corner of the screen.
Note
All default parameter values used in the 3D web client were
chosen accordingly to the standard settings (e.g., the standard
predefined tile size is 125m x 125m) specified in the preference
settings of the KML/COLLADA/glTF Exporter
(cf. Section 4.6.7.1). The
parameter name with the suffix (*) denotes that this parameter is
mandatory; otherwise it is optional.
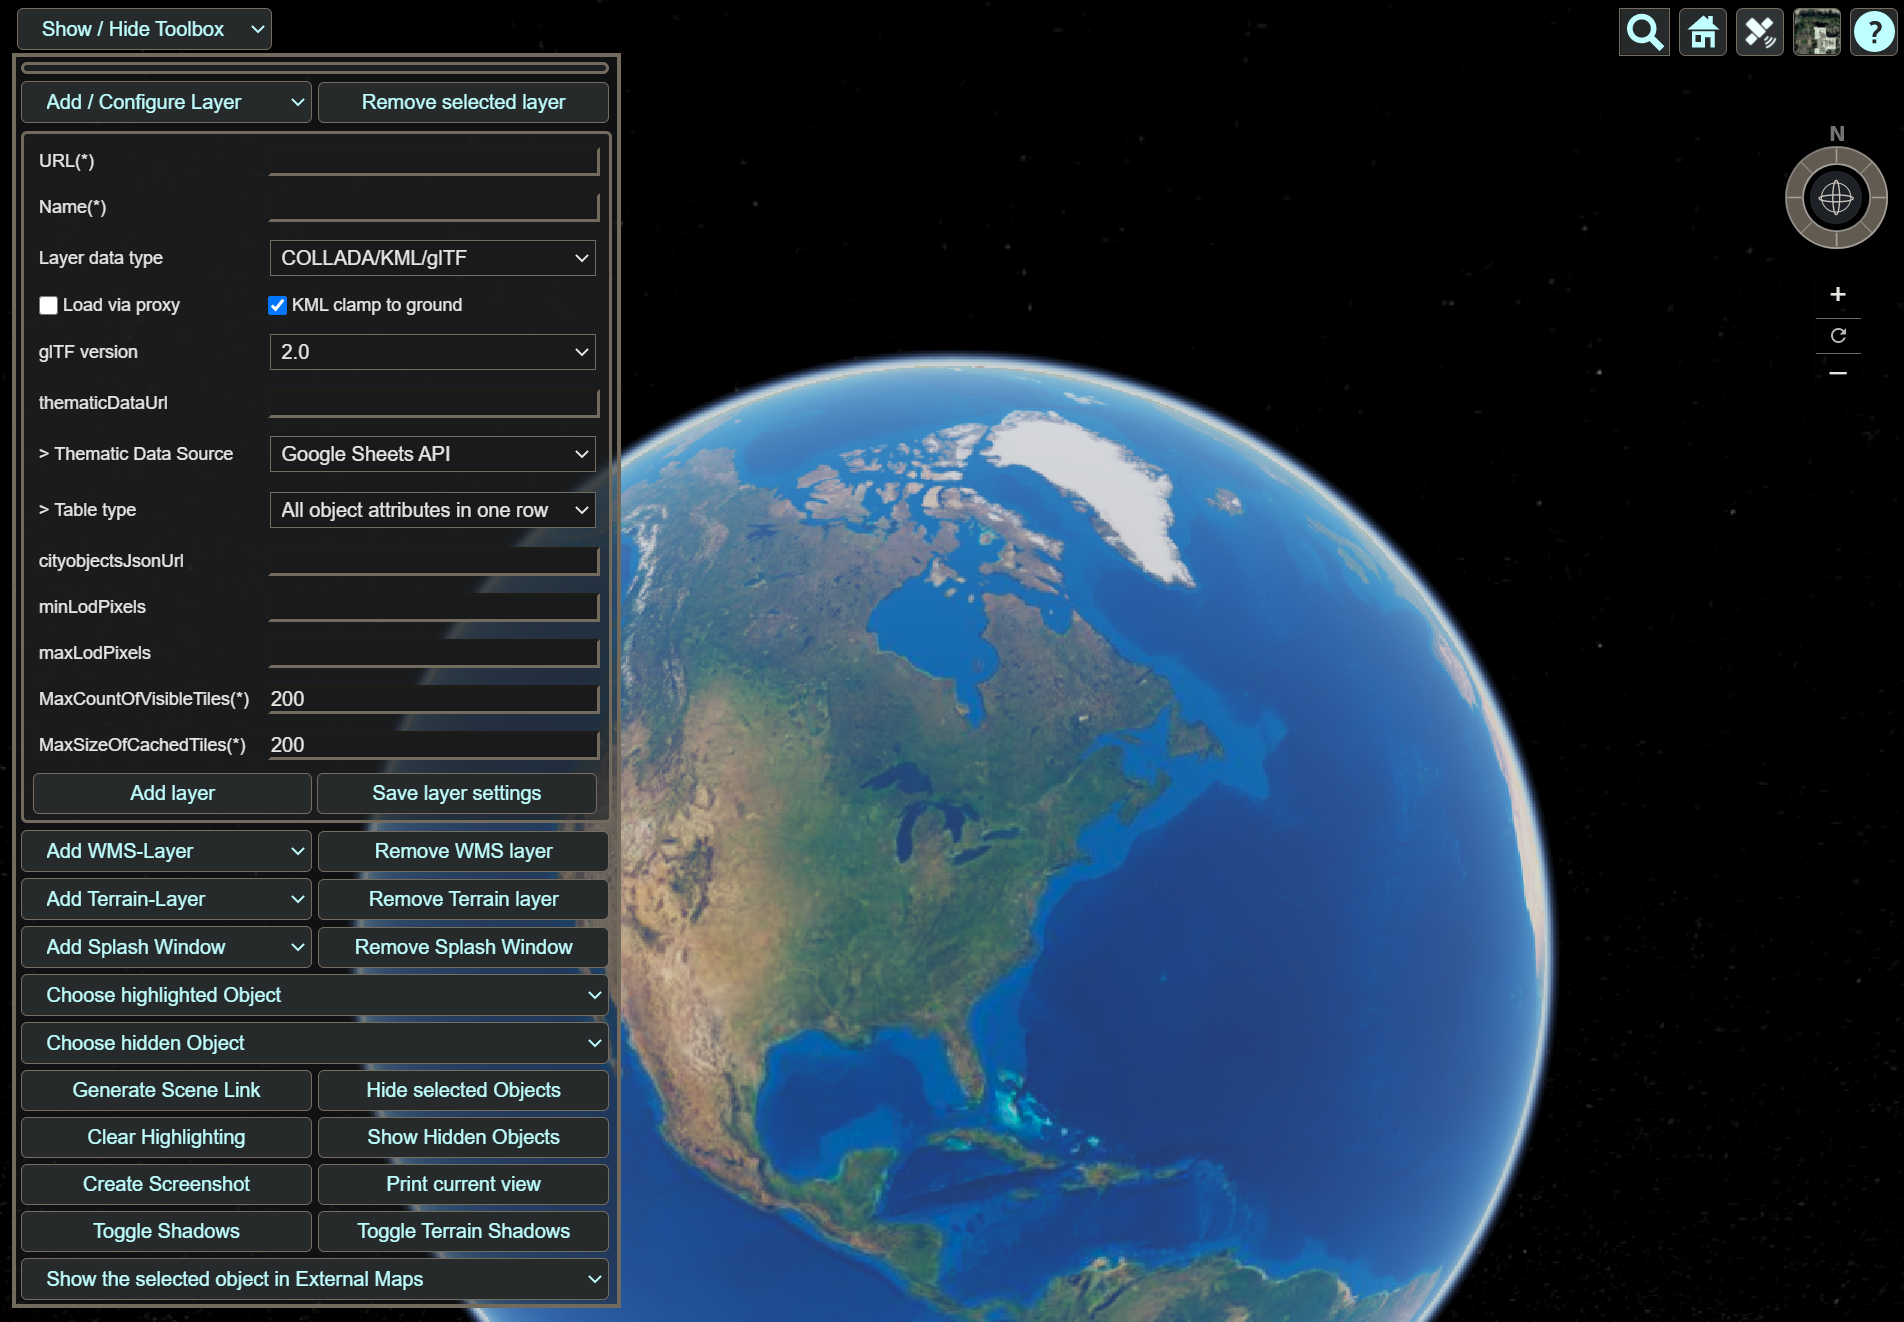
Fig. 6.10 The input panel for adding a new KML/glTF layer with thematic data in the 3DCityDB Web Map Client
The following information can/should be provided while importing KML/glTF models with thematic data:
| Property | Description |
URL(*) |
The web link of the master JSON file (cf. Section 4.6) holding the relevant meta-information of the data layer to be imported. |
Name(*) |
A proper layer name must be specified which will be listed at the top of the input panel (in the top left corner of the screen) once the KML/glTF data layer has been successfully loaded into the 3D web client. |
Layer data type |
The type of models to be imported, currently supports:
COLLADA/KML/glTF and Cesium 3D Tiles datasets. |
Load via proxy |
(Only for KML datasets) (Only on 3DCityDB websites) Specify if the KML datasets should be loaded using the built-in proxy server hosted in the 3DCityDB server. This can be used for remote KML datasets hosted on servers that do not allow Cross-Origin Resource Sharing (CORS). |
KML clamp to ground |
(Only for KML datasets) Specify if the KML models should be clamped to the ground on the globe. This is useful when the KML dataset does not have correct heights and thus may be hidden under the terrain. |
glTF version |
(Only for glTF datasets)
The version of the glTF models being imported. Currently supports:
2.0 (latest), 1.0 and 0.8. |
thematicDataUrl |
The URL of the thematic data source. This could be a Google Spreadsheets
e.g. with the following structure
https://docs.google.com/spreadsheets/d/<spreadsheet_id>
or a table/view published by PostgREST
e.g. with the following structure
https://example.com:3000/<table_name>. |
> Thematic Data Source |
The thematic data source type, currently supports:
Google Sheets API,
PostgreSQL REST API and
KML Documents as data source. |
> Table type |
The type of tables containing thematic data, currently supports:
All object attributes in one row (horizontal) and
One row per object attribute (vertical). |
cityobjectsJsonUrl |
The URL of the JSON file which can be generated automatically by using the KML/COLLADA/glTF Exporter (cf. Section 4.6.7.1). For more information please refer to explantation below this table. |
minLodPixels and
maxLodPixels |
The minimum and maximum limit of the visibility range for each data layer to control the dynamic loading and unloading of the data tiles. For more information please refer to explantation below this table. |
maxCountOfVisibleTiles |
The maximum number of allowed visible data tiles. For more information please refer to explantation below this table. |
maxCountOfVisibleTiles |
The maximum allowable cache size expressed as a number of data tiles. For more information please refer to explantation below this table. |
More details on
cityobjectsJsonUrl: This JSON file contains a list of GMLIDs of all 3D objects which were exported and might be distributed over different tiles. For every 3D object, it is also stored in which tile it is contained together with its envelope represented using a bounding box in WGS84 lat/lon. These location information can be used to search for a certain 3D object with the help of the Geocoder widget (the lupe symbol in the top right corner of the screen), which has been extended to support a specific geocoding process performed in the following manner: In the input field, either a GMLID of a 3D object or an address can be entered. If an object with the given GMLID is found in the JSON file, the camera perspective will be adjusted to look at the center point of the 3D object with a proper oblique view. If not, the search engine Nominatim for OpenStreetMap shall be used and the map view will be adjusted to the returned location and bounding box.More details on
minLodPixelsandmaxLodPixels: The maximum visibility range can start at0and end at an infinite value expressed as-1. Optionally, the user can directly specify the two parameter values within the 3D web client. Otherwise, the parameter values will be achieved from the master JSON file, which also contains the parametersminLodPixelsandmaxLodPixelsand their values which have been specified using the KML/COLLADA/glTF Exporter before performing the export process.With these two parameters, the 3D web client implements the so-called Level of Details (LoD) concept which is a common solution being used in 3D computer graphics and GIS (e.g. KML NetworkLinks) for efficient streaming and rendering of tiled datasets. According to the LoD concept, the data tiles with higher resolution should be loaded and visualized when the observer is viewing them from a short distance. When data tiles are far away from the observer, the data tiles with higher resolution should be substituted by the data tiles with lower resolution. In order to realize this LoD concept in the 3D web client, each data tile which is being intersected with the current view frustum will be projected onto the screen while navigating the Earth map. Subsequently, the diagonal length of the projected area on the screen will be calculated by the 3D web client to determine whether the respective data tile should be loaded or unloaded. If the diagonal length is greater than
minLodPixelsand less thanmaxLodPixels, the respective data tile will be loaded and displayed; otherwise it will be hidden from display and unloaded. Of course, all data tiles lying outside of the view frustum are unloaded and invisible anyway.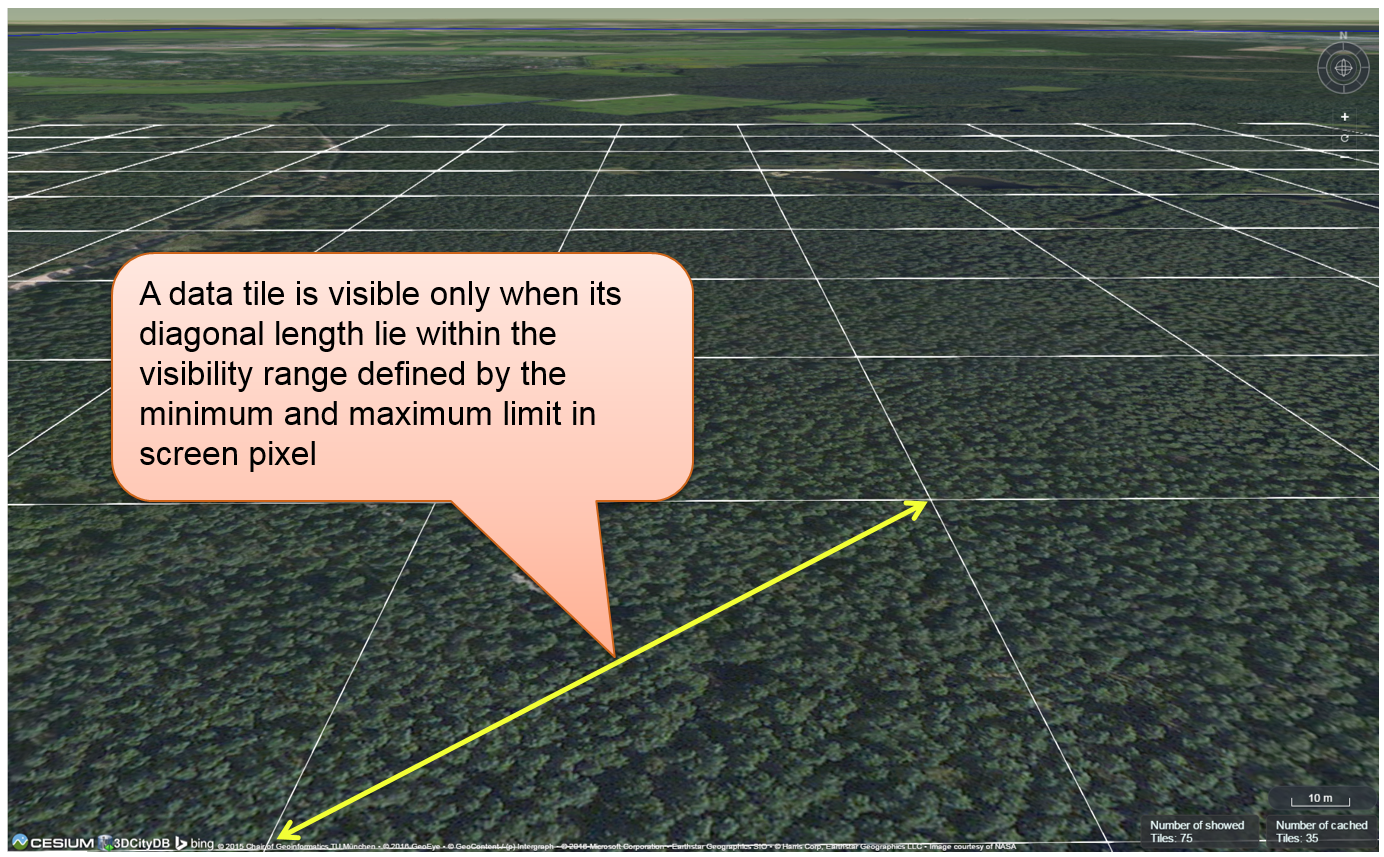
Fig. 6.11 Efficient determination of which data tiles should be loaded according to the user-defined visibility range in screen pixel
More details on
maxCountOfVisibleTiles: Loading massive amounts of data tiles often result in poor performance of the 3D web client or even memory overload of the web browser. This could happen when, for example, the visibility range (determined by the parametersminLodPixelsandmaxLodPixels) starts at a very small value and ends at an infinite size. In this case, each data tile will always be visualized even though it only takes up a very small screen space. This issue can be avoided by a proper setting of the parametermaxCountOfVisibleTiles. When this limit is reached, any additional data tiles that are farthest away from the camera will not be shown, regardless the size of screen space they occupy. Per default, this parameter receives a value of 200, which is appropriate in most use cases. However, depending on data volume of each tile and the hardware you use, this parameter value has to be adjusted by means of practical tests.More details on
maxSizeOfCachedTiles: As mentioned before, the 3D web client implements a caching mechanism allowing for high-speed reloading of those data tiles that have been loaded before and which are stored in the memory of the web browser. In order to prevent memory overload, the parametermaxSizeOfCachedTilescan be applied. With this parameter, the 3D web client implements the so-called Least Recently Used (LRU) algorithm which is a caching strategy being widely used in many computer systems. According to this caching algorithm, newly loaded data tiles will be successively put into the cache. When the cache size limit is reached, the 3D web client will remove the least recently visualized data tiles from the cache. By default, the value of this parameter is set to200and can of course be increased to achieve a better viewing experience depending on the hardware you use.
Usage example
In this example, a tiled KML/glTF dataset of buildings in the Manhattan district of New York City (NYC) will be visualized on the 3D web client. This dataset is derived from the semantic 3D city model of New York City (NYC) which has been created by the Chair of Geoinformatics at Technical University of Munich on the basis of datasets provided by the NYC Open Data Portal.
The following parameter values should be entered into the corresponding input fields:
url |
http://www.3dcitydb.net/3dcitydb/fileadmin/public/3dwebclientprojects/NYC-Model-20170501/Building_gltf/Building_gltf_collada_MasterJSON.json |
name |
Buildings |
Layer data type |
COLLADA/KML/glTF |
glTF version |
1.0 |
thematicDataUrl |
https://docs.google.com/spreadsheets/d/1DbkMUSYW_YlE48MUxH5fak56uaCL8QXNrBgEr0gfuCY |
> Thematiic Data Source |
Google Sheets API |
> Table Type |
All object attributes in one row |
cityobjectsJsonUrl |
|
minLodPixels |
125 |
maxLodPixels |
-1 or 1.7976931348623157e+308 |
maxCountOfVisibleTiles |
200 |
maxSizeOfCachedTiles |
200 |
After clicking on Add layer, a data layer will be loaded into the 3D
web client and the corresponding layer name Buldings
will be listed above the input panel. The Earth map can be zoomed to the
extent of the loaded data layer by double-clicking on the layer name.
The parameter values of the data layer (its radio button must be
activated) can be changed and applied at any time by clicking on the
Save layer settings button.
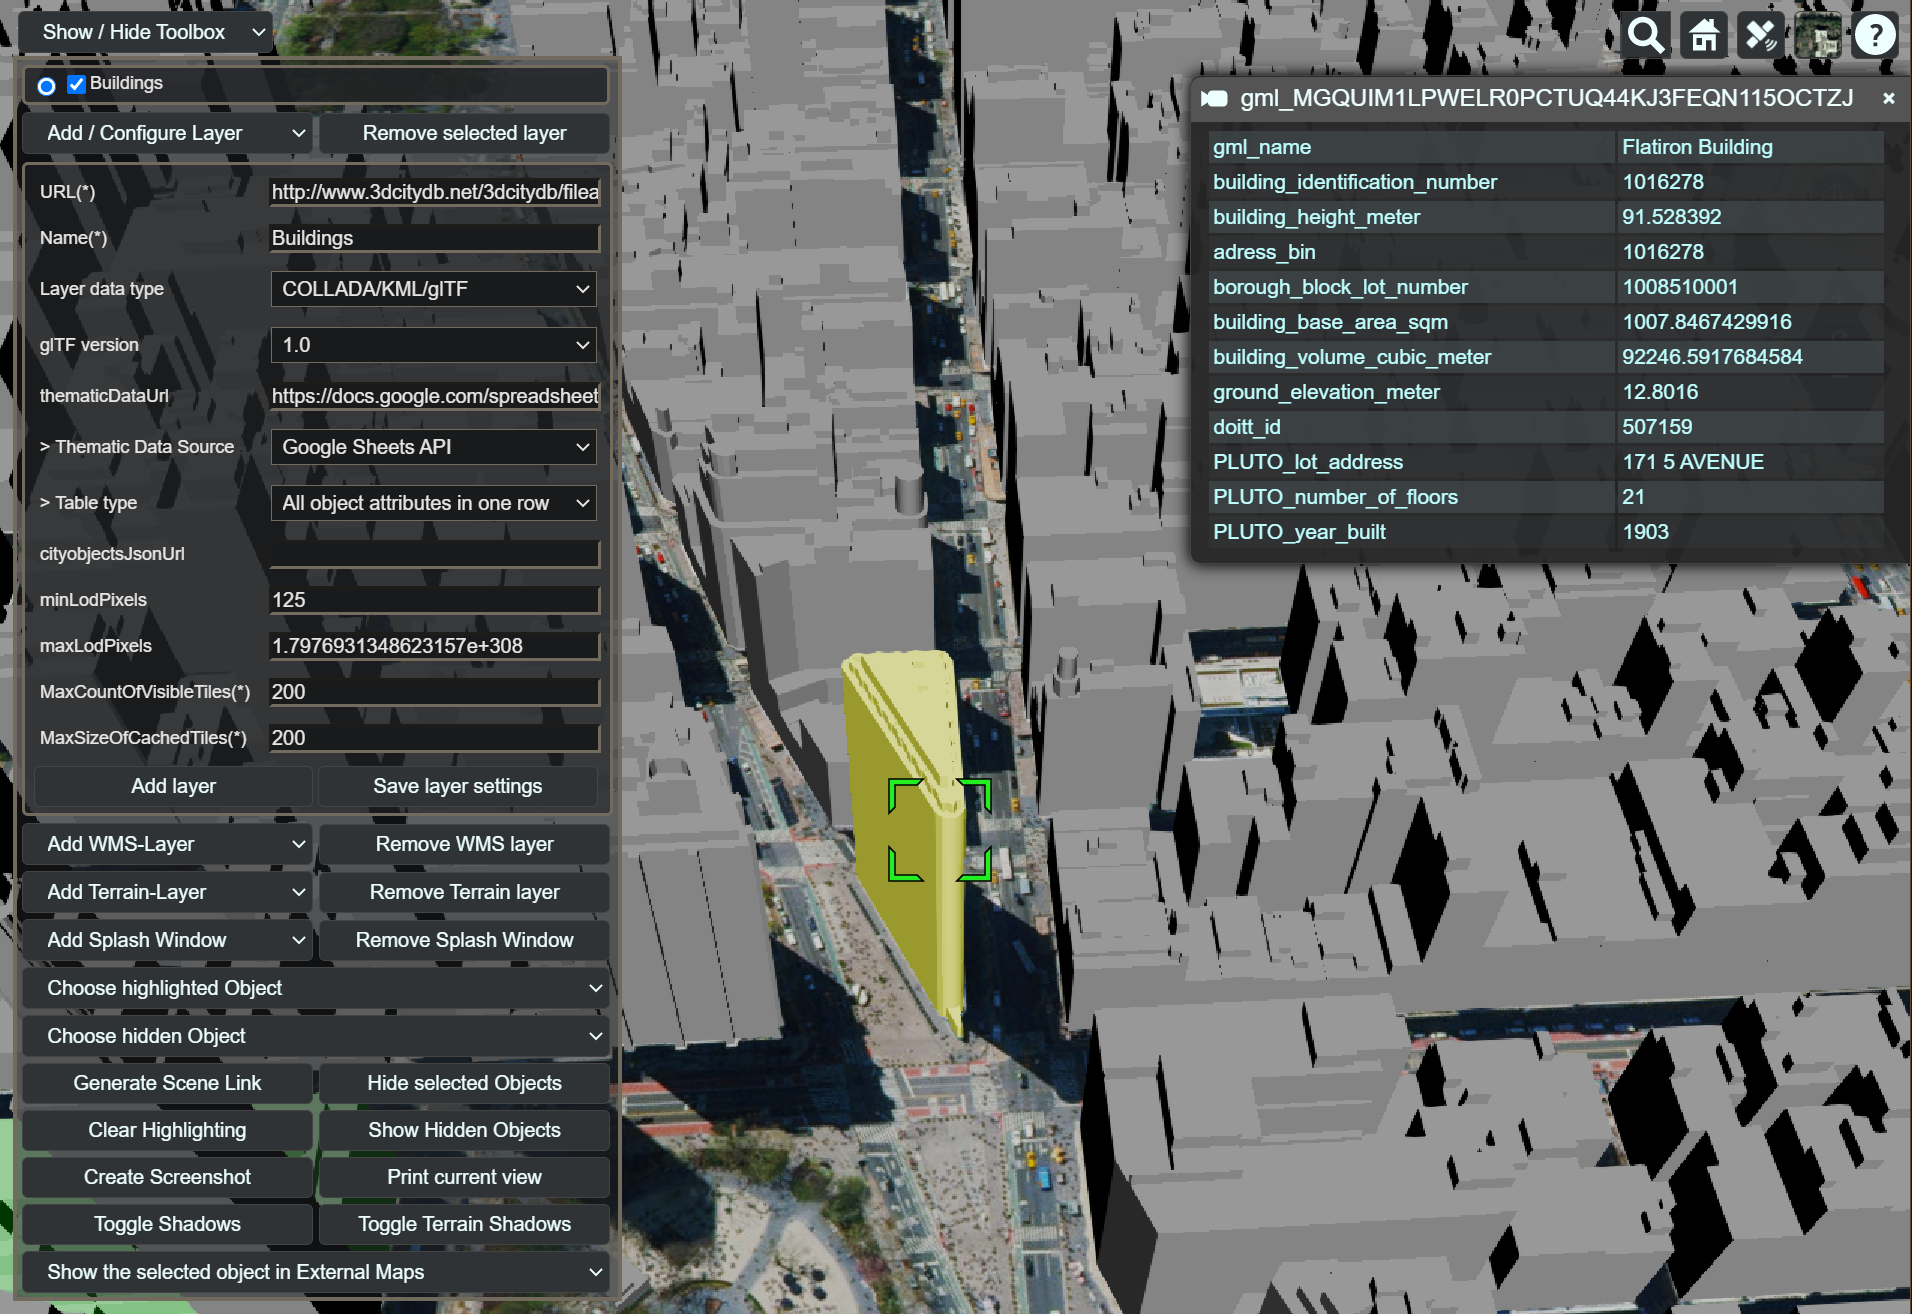
Fig. 6.12 Screenshot showing how to add a new KML/glTF data layer into the 3D web client
Users are also able to control the visibility of the selected data
layers by deactivating the checkbox in front of the layer’s name
or clicking on the Remove selected layer button to completely
remove the layer from the 3D web client.